 Flow metrics are becoming increasingly popular among businesses, especially those that follow Agile and Lean principles. Some companies are on board with these metrics and actively keep an eye on them, but there are still plenty of businesses out there not taking full advantage of what flow metrics have to offer. You might be wondering, "What the heck are flow metrics, and how can I use them to my advantage?" Well don't worry, that's exactly what we're going to tackle in this article. We'll define flow metrics, then we'll break down three flow metrics that can help you boost efficiency and get things running smoothly in your organization. Let's dive in and get those insights flowing!
At a high level, flow metrics are a way of measuring how value is being developed and delivered to clients. They are designed to measure the flow of work related to software development, like how long it takes, if there are bottlenecks, how the work is distributed across teams, and how much work a team can realistically get done within any given sprint. Companies can use flow metrics to make sure that they are connecting the dots between business strategy, practices, and outcomes.
1. Cycle Time
This metric is like the stopwatch for your work items. It measures the time it takes for a task or project to go from start to finish. By keeping an eye on cycle time, you can get a good sense of how efficiently your team is working. If the cycle time is too long, it might mean there are some roadblocks or delays slowing things down. By identifying these bottlenecks, you can take action to speed up the process and get things moving faster.
Insight
Cycle time gives you a clear picture of how long it takes to get stuff done. It helps you identify areas where things are getting stuck and figure out ways to streamline the workflow. By reducing cycle time, you can improve productivity and get more tasks completed in less time. Cycle Time can help answer the following questions:
- How long does it take for work items to move through our process?
-
Are there any bottlenecks or delays in our workflow?
-
How predictable are our delivery times?
-
Are there any seasonal or cyclical patterns in our workflow?
-
How effective are our process improvements?
-
What is the impact of changes in team composition or workflow adjustments?
Jira Software How To
Jira's Control Chart is a handy solution that comes built-in with Jira to help you assess and analyze the overall Cycle Time and Lead Time. Whether it's a sprint, a specific product version, or any other unit you define, this tool allows you to gather and evaluate the data quickly.
You can easily access the Control Chart by navigating to the Reports tab in Jira. Once you're there, you'll notice that the X-axis represents calendar dates, while the Y-axis represents the elapsed time in days. With the Jira Chart, you have the ability to:
- Select a specific point, whether it's an issue or a cluster of issues, and get average data for it. This allows you to zoom in and focus on specific areas of interest.
- Analyze and examine a chosen period within a particular project. This way, you can narrow down your analysis and get insights for specific timeframes.
- Modify and adjust the analysis period as per your requirements. Flexibility is key, and the Control Chart allows you to adapt the timeframe to suit your needs.
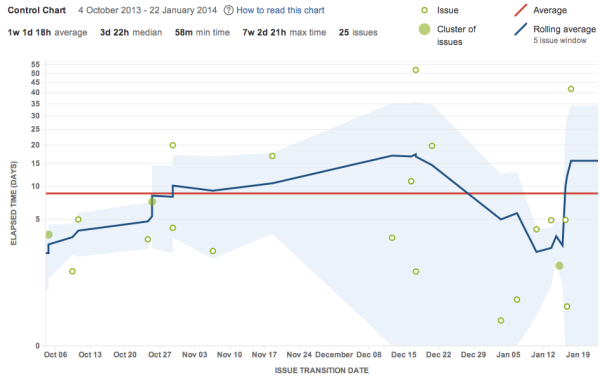
Image Credit: Atlassian
Jira Align How To
Jira Align's Process Step Cycle Time report is the perfect report for generating views of the Value Stream. Value streams are the backbone of an organization's value delivery process, encompassing the steps involved in creating a continuous flow of value for customers. To gain insights into the efficiency of these process steps, the Process Step Cycle Time report comes to the rescue. This report presents three informative charts that provide statistics on work items as they flow through the value stream.
Simply select the desired value stream from the convenient drop-down menu located in the upper-left corner of the page. To narrow down the analysis, specify a date range in the corresponding fields. If you're working within a specific Program Increment (PI), the date range will automatically populate for you, making it even more convenient to explore the metrics.
The three charts in the Process Step Cycle Time report offer valuable insights into the flow of work items through your value stream. They allow you to track and analyze key metrics related to process steps, enabling you to make data-driven decisions and drive continuous improvement.
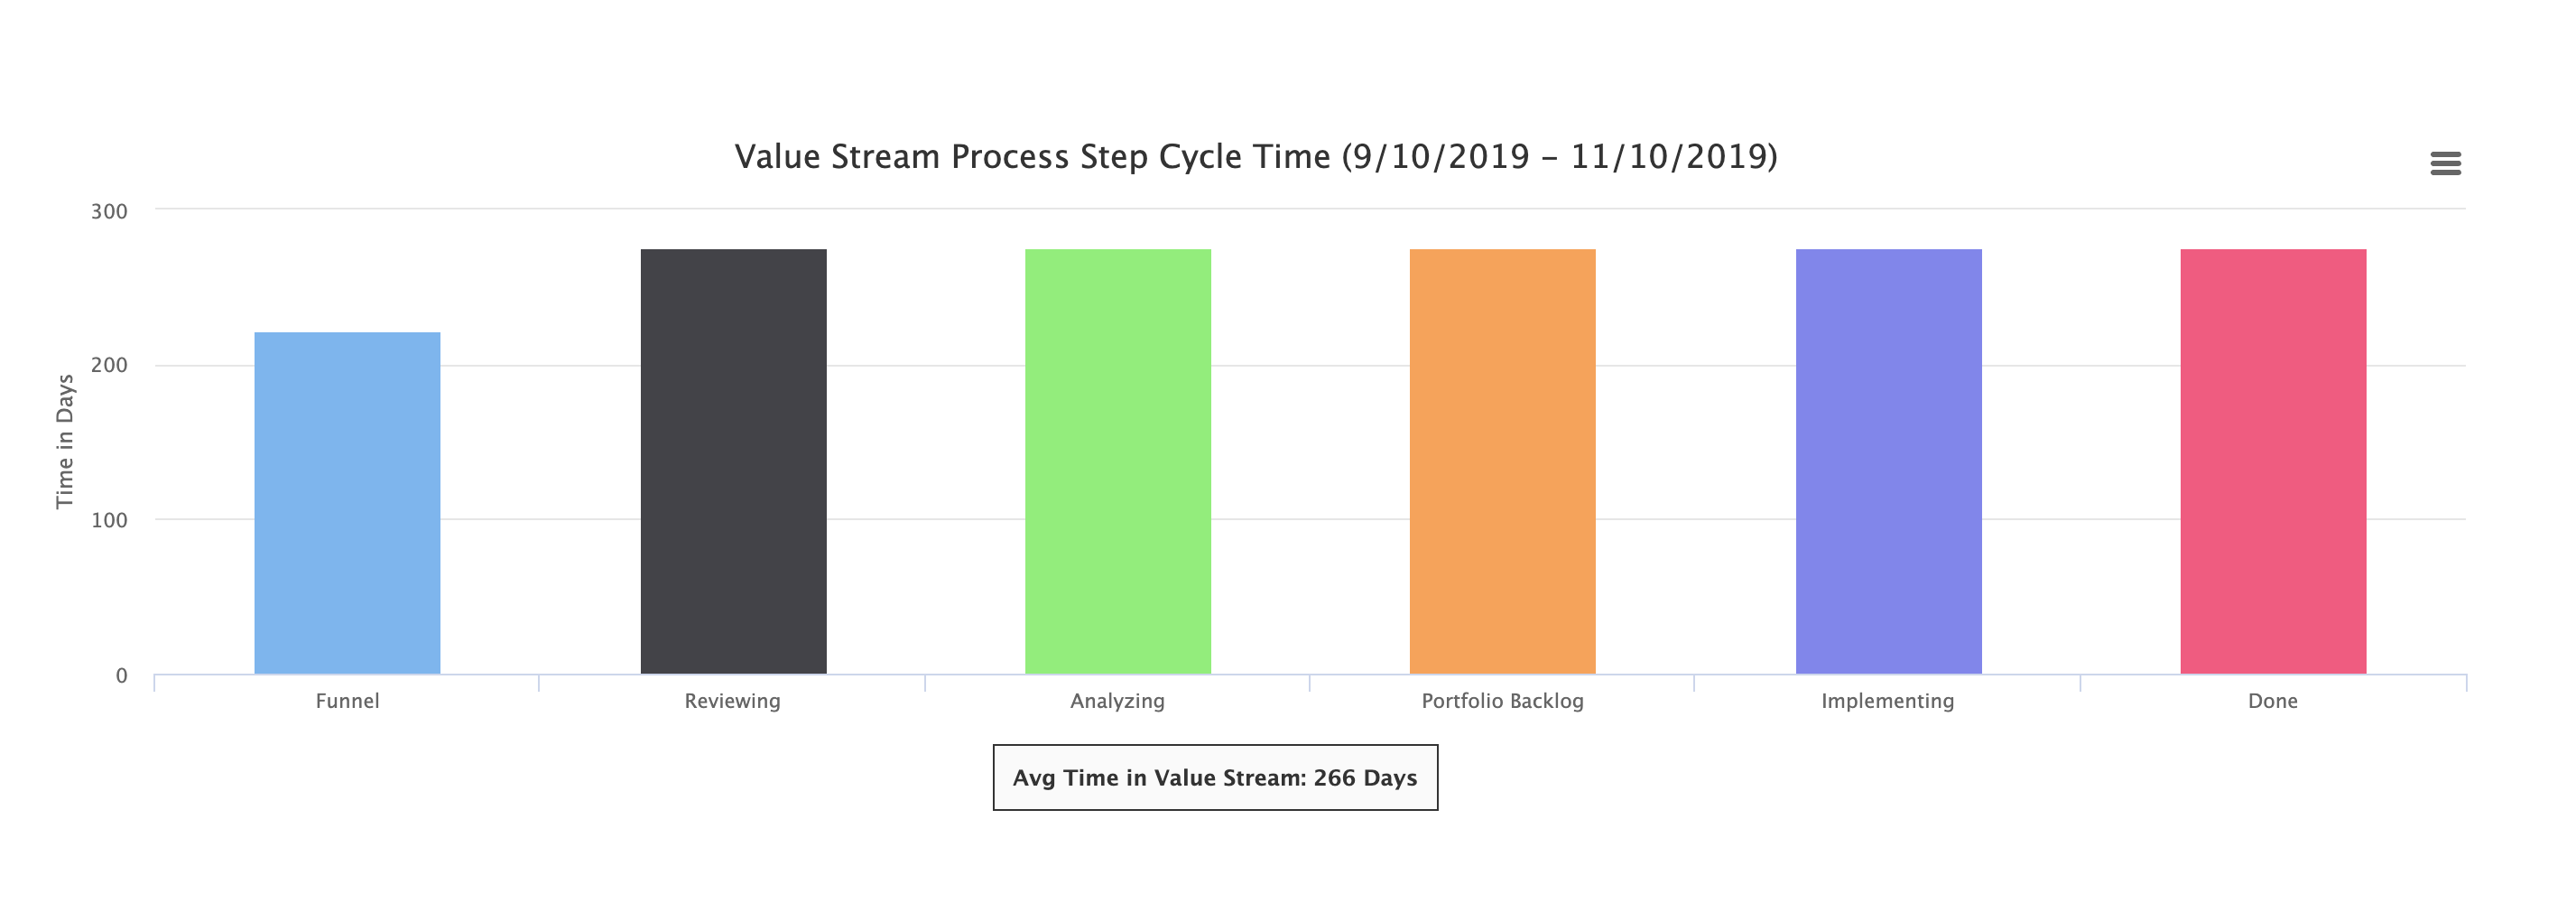
Image Credit: Jira Align
Move Your Teams Forward
Once you have the data and have generated insights, you can review them and decide what to do. Here are some ways you can help your teams grow:
-
Identify the bottlenecks: The first step is to identify the specific stages or activities in your workflow that are causing delays or contributing to the longer cycle time. Analyze the flow of work and pinpoint where work items tend to get stuck or take longer than expected.
-
Map the process: Visualize and map out your workflow from start to finish. This helps in visualizing the steps involved, dependencies, and handoffs between team members or departments. By having a clear overview of the process, you can identify areas where improvements can be made.
-
Eliminate waste: Look for opportunities to eliminate waste or non-value-adding activities in your process. This could involve reducing unnecessary handoffs, minimizing waiting times, streamlining approvals, or automating manual tasks. Identify any low-value activities that can be eliminated or optimized to make the workflow more efficient.
-
Track trends over time: tracking cycle time is not enough. Make sure you are tracking your cycle time trends. Are they increasing or decreasing? Cycle times naturally vary a bit across teams, programs, portfolios, and companies. Once you've eliminated waste and are happy with your cycle times, look at other metrics for additional insights.
2. Distribution
Another valuable metric that can provide insights into your team's work is the Distribution Metric. This metric allows you to visualize and analyze how work is allocated across different issue types, such as defects, stories, and tasks. By examining the distribution of work, you can gain a better understanding of how your team is spending their time and efforts.
Insights
Distribution helps uncover valuable insights and make data-driven decisions to improve your team's productivity and effectiveness. It answers questions like:
- How much of our work is dedicated to addressing defects?
- What is the proportion of effort invested in developing new features (stories)?
- Are tasks consuming a significant portion of our team's capacity?
By examining the distribution of work across issue types, you can uncover valuable insights and make data-driven decisions to improve your team's productivity and effectiveness.
Jira How To
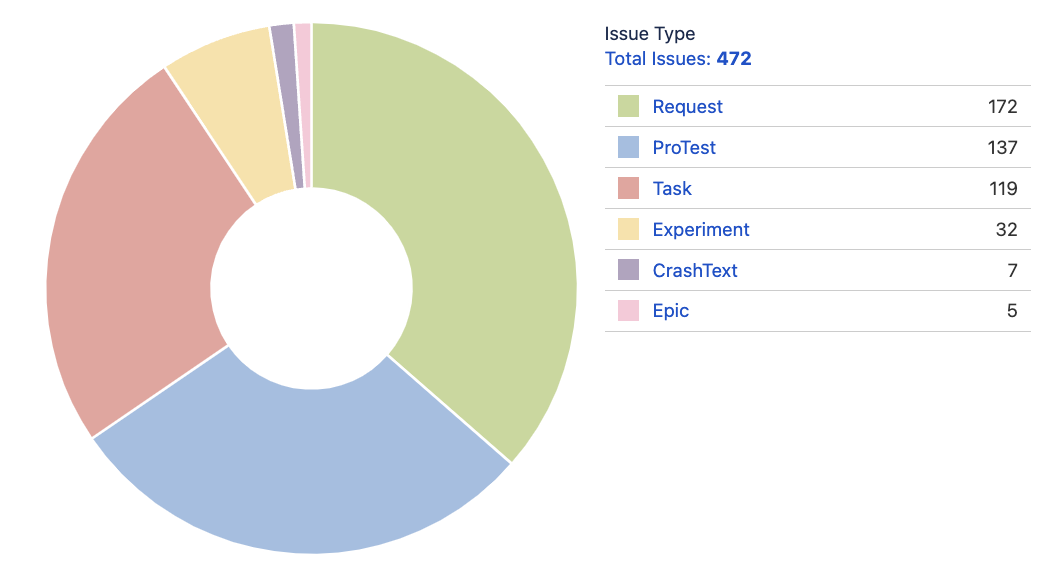
The Pie Chart gadget in your Jira Dashboard is a useful tool that presents statistical data in a customizable table format. To make the most of this gadget, start by creating a filter to gather all the open issues from a specific project or a group of projects. Once you have the filter in place, you can configure the gadget to display the statistical data based on this collection of issues. Make sure to set the statistic type to Issue Type. The pie chart allows you to compare the count of issues versus their respective issue types. This provides a clear and organized view of the data for analysis and decision-making purposes.
Jira Align How To
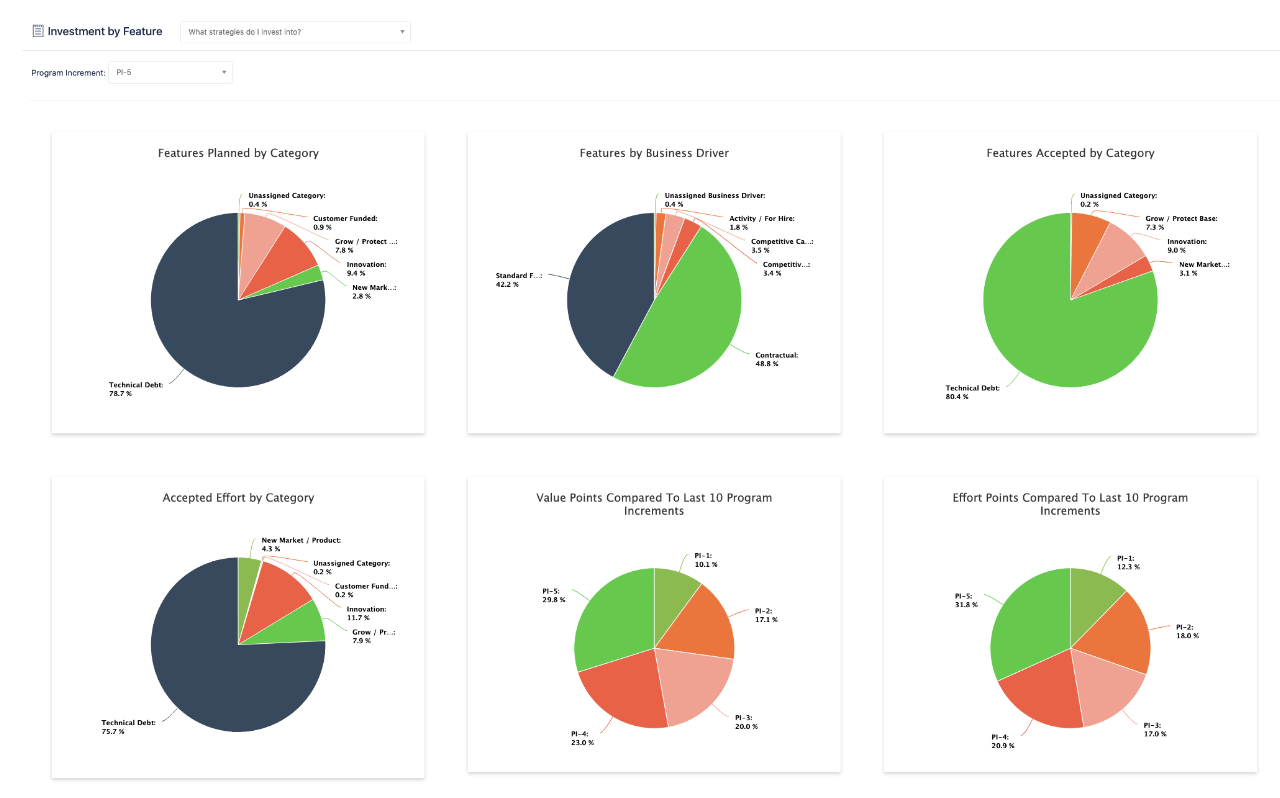
The Investment by Feature report offers valuable insights into the breakdown of features within a specific PI, categorized by their Investment Category and Business Driver. This report serves as a useful tool for Program-level leaders, such as Release Train Engineers, or Program Managers, during the PI planning preparations. It allows them to assess the backlog prioritization activities and ensure a well-balanced mix of features for the upcoming PI, supporting informed decision-making and effective planning.
Move Your Teams Forward
Once you understand the distribution of work you can take several steps to help your team improve:
-
Identify Imbalances: Analyzing the distribution of work can reveal imbalances or disproportionate allocation of tasks. If one category (e.g., defects) consistently occupies a significant portion of the team's effort, it may indicate underlying issues in quality that should be addressed. Identify any skewed distribution and determine if it aligns with the team's goals and priorities.
-
Address Root Causes: If defects are consuming a significant portion of the team's work, it may indicate quality or process issues that need attention. Collaborate with the team to identify root causes and implement strategies to address them. This may involve improving testing practices, enhancing code reviews, or investing in automated testing tools to reduce the number of defects.
-
Focus on User Value: New user functionality represents the value delivered to customers or end-users. Ensure that the team's efforts are aligned with the organization's goals and customer needs. Regularly assess the value generated by new user functionality and prioritize features that have the highest impact. Foster a customer-centric mindset within the team and seek feedback to continuously improve the user experience.
-
Continuous Learning and Improvement: Encourage the team to reflect on their work distribution and identify areas for improvement. Promote a culture of learning and experimentation, allowing the team to explore different approaches or technologies that can optimize their work distribution. Foster knowledge sharing among team members and provide opportunities for skill development to enhance their capabilities.
-
Collaboration and Cross-Functional Teams: If the distribution of work is unbalanced across different team members or departments, consider fostering cross-functional collaboration. Encourage knowledge sharing and collaboration between individuals with different expertise. This can help distribute work more evenly, promote learning, and enable a holistic understanding of the product or service being developed.
Regularly reassess the distribution and adapt your approach to ensure continuous improvement and alignment with the team's goals and organizational priorities.
3. Velocity
Velocity measures the amount of work a team can sustainably commit to within a given time frame, typically a sprint or Program Increment. It provides valuable insights into a team's productivity and helps in planning and forecasting future work. By understanding velocity and leveraging it effectively, both teams and enterprises can optimize their delivery and make informed decisions.
Insights
Velocity provides teams and enterprises with the necessary data to make data-driven decisions, improve planning accuracy, optimize resource allocation, and drive continuous improvement. It acts as a valuable tool for measuring progress, increasing productivity, and ensuring the successful delivery of value to customers. It answers questions like:
-
How much work can the team complete in a sprint?
-
Is the team's velocity consistent or fluctuating?
-
How should we plan future work based on velocity?
-
How effective are our process improvements and adjustments?
Jira Software
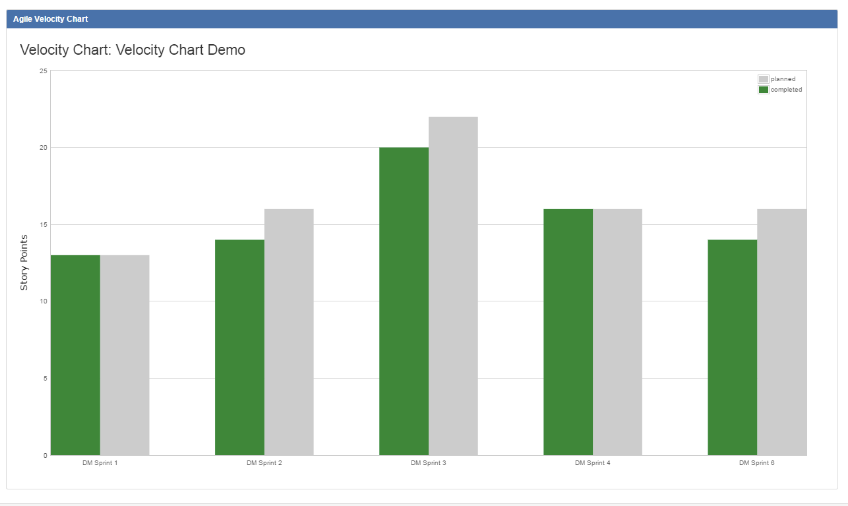
The velocity chart is a valuable tool for Scrum teams to gauge their average work completion during sprints. By tracking forecasted and completed work over multiple sprints, teams can make informed predictions about their backlog. The more sprints included in the chart, the more accurate the forecast becomes.
To access the velocity chart in your company-managed Jira Software project, simply navigate to the project's sidebar, select Reports, and choose Velocity Chart. The chart will then be displayed, showcasing the team's performance over the last 7 completed sprints.
Jira Align
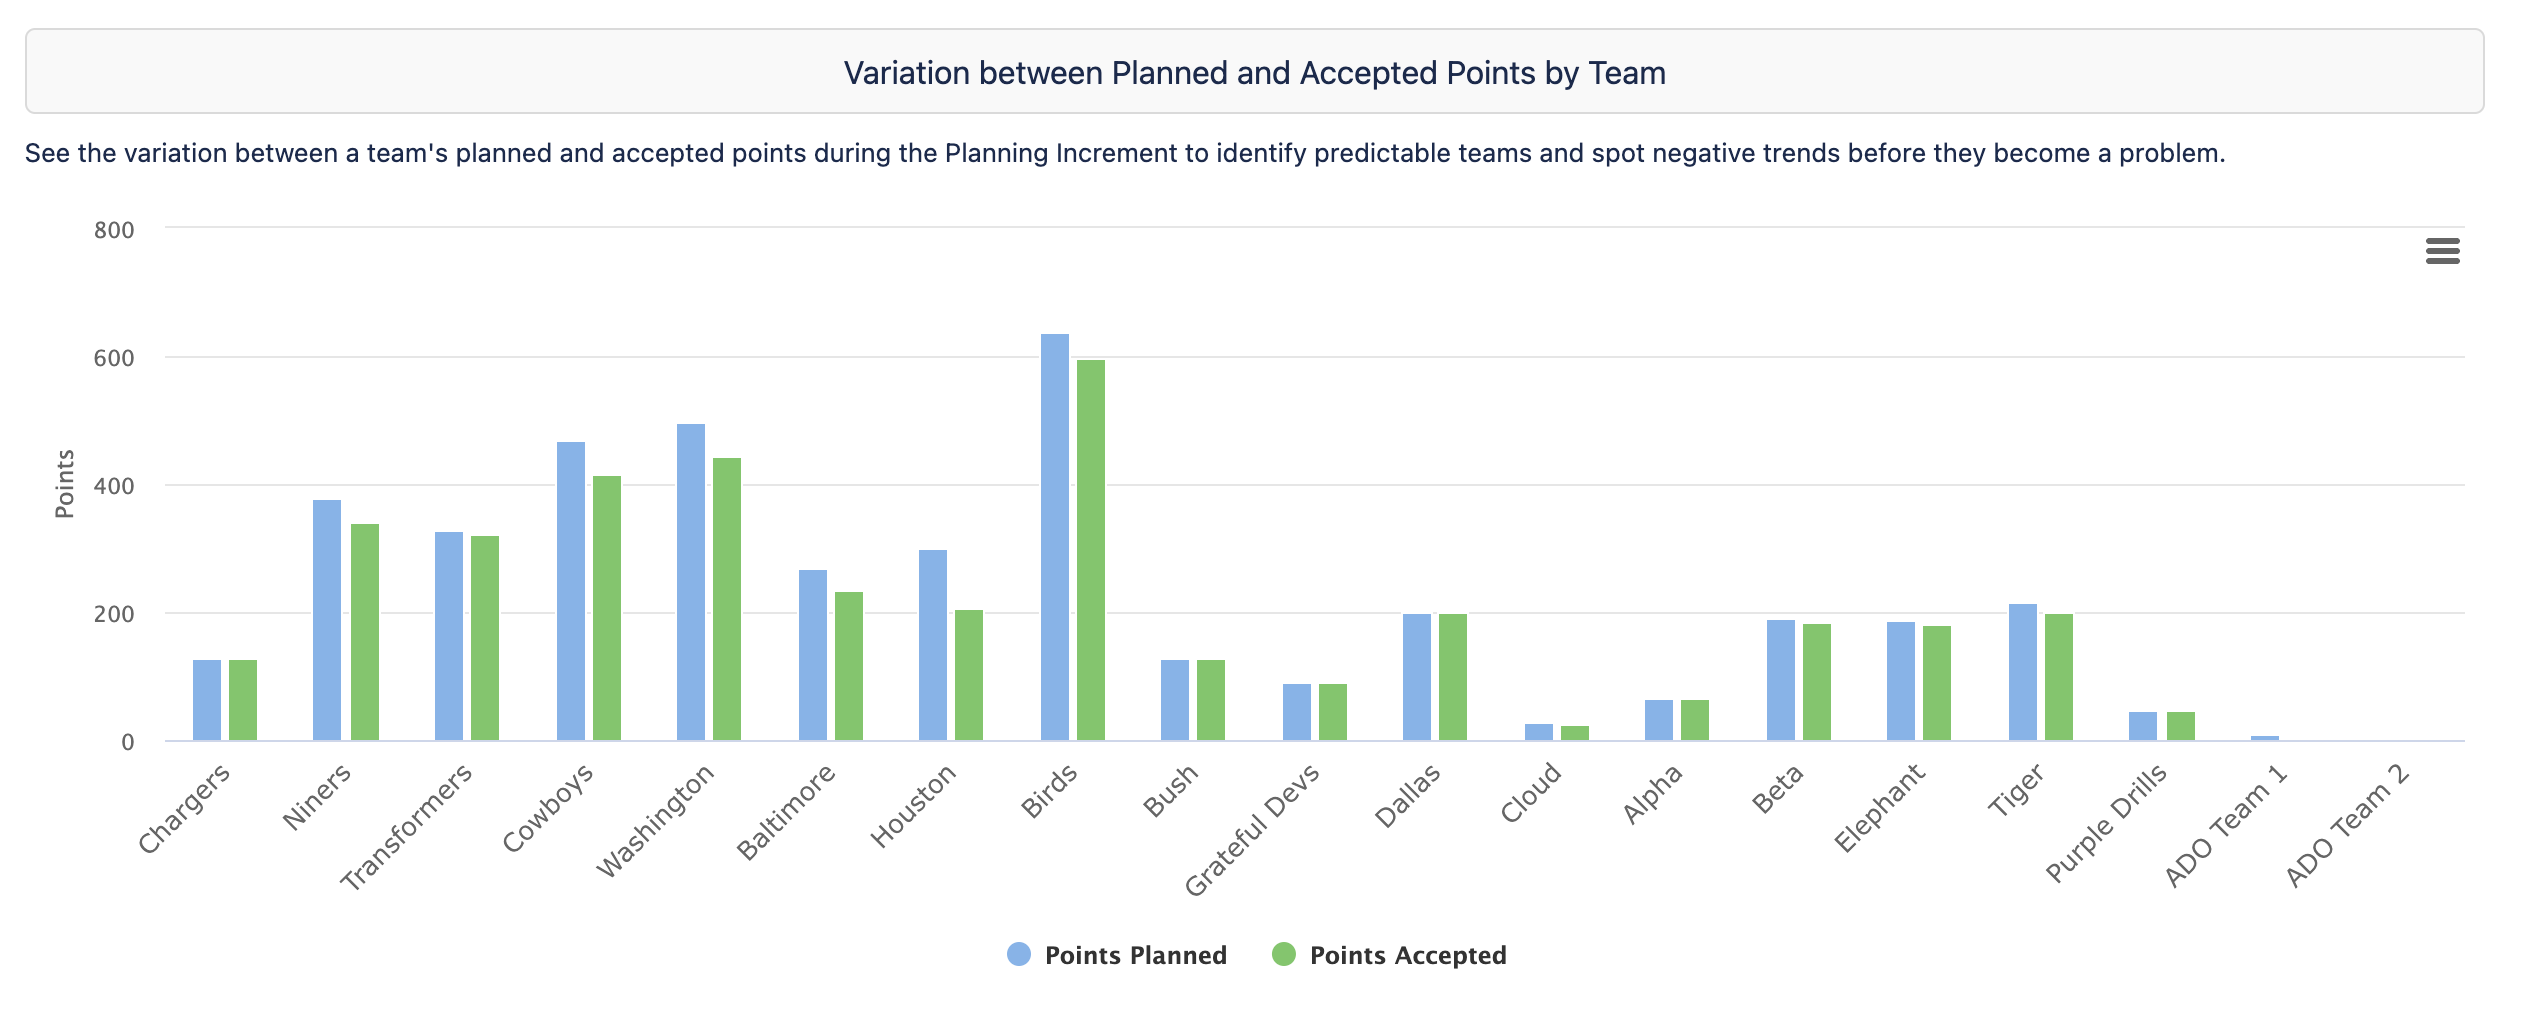
The Story Point Progress by Team report is a valuable tool for comparing planned and accepted story points by team across one or more program increments. Presented in a dual-bar chart grouped by time period, this report allows you to track team performance and identify any variations or trends. By reviewing this report regularly, particularly during program retrospectives, you can make informed decisions about future work commitments and identify highly predictable teams. It also helps in spotting negative trends early, enabling timely adjustments to improve the chances of meeting commitments. Additionally, the report provides the convenience of easily exporting the data for ongoing status reporting purposes.
Move Your Teams Forward
Once you understand trends in velocity, there are several ways you can help them move forward and improve:
- Set Realistic Goals: Based on the team's velocity data, work with the team to set realistic goals and expectations for future sprints. Use the velocity as a reference point to estimate the amount of work the team can comfortably handle and commit to delivering in each sprint. Avoid overloading the team with excessive work that may lead to burnout or missed deadlines.
- Continuous Improvement: Use the velocity data as a starting point for continuous improvement. Engage the team in retrospectives to discuss what went well and identify areas for improvement. Analyze factors that influenced velocity, such as external dependencies, bottlenecks, or inefficiencies in the workflow. Encourage the team to experiment with different approaches, processes, or tools to optimize their velocity.
- Identify and Address Bottlenecks: Velocity can provide insights into potential bottlenecks within the team or the overall workflow. If the velocity is consistently low or fluctuating, it may indicate areas where work is getting stuck or delayed. Collaborate with the team to identify these bottlenecks and take proactive steps to address them. This could involve removing blockers, improving communication and collaboration, or reallocating resources to optimize the flow of work.
- Skill Development: Analyzing velocity trends can highlight areas where the team may benefit from skill development or training. Identify any gaps in knowledge or expertise that may be impacting the team's productivity and consider providing learning opportunities or coaching to enhance their capabilities. Upskilling team members can lead to improved efficiency and higher velocity over time.
- Celebrate Success and Motivate the Team: Recognize and celebrate the team's achievements when they consistently meet or exceed their velocity targets. Positive reinforcement and acknowledging their efforts can boost morale and motivation. Encourage a collaborative and supportive environment where team members feel empowered to share ideas and contribute to the team's success.
Remember, velocity is not a static metric but a dynamic one that evolves over time. It is important to regularly review and refine your approach based on the team's feedback and changing circumstances. By using velocity as a guiding tool and implementing these strategies, you can help your team continuously improve, enhance their productivity, and deliver valuable outcomes.
Data without Context is Just Data
Data is a valuable tool that provides insights and supports decision-making, but remember that data alone is not sufficient for accurate interpretation and problem resolution. Teams may have similar data, but the root causes can vary greatly, emphasizing the need for a human-centered approach in analyzing and addressing the challenges at hand. Context is essential in understanding the underlying factors influencing the data and identifying appropriate actions. While data can initiate conversations and facilitate connections, it is through human interaction, investigation, discussion, and collaboration with the teams that a comprehensive understanding can be gained.
Calming the Chaos of Misalignment: SAFe® Summit Takeaways - Join Our New Webinar!
Did you get a chance to attend the 2023 SAFe® Summit in Nashville this year? If not, don’t worry, Atlassian and Isos Technology have got you covered! From keynote sessions and technical talks to customer stories and workshops, join our panel of seasoned agile experts as they delve into the top highlights from the summit, equipping you with the essential knowledge to navigate the dynamic landscape of agile at scale.
Join our webinar, co-presented by Atlassian and Isos Technology, on Tuesday, September 26th, 2023 at 10:00 AM PT/1:00 PM ET as our speakers discuss:
- Unveiling SAFe Summit Takeaways: Gain exclusive insights into the most crucial and insightful moments from the 2023 SAFe Summit. Our speakers will distill the essence of the summit, providing you with a snapshot of the latest trends, success stories, and innovations.
- Addressing Misalignment: Misalignment can be a major roadblock to agile transformation. Our panel will discuss strategies to identify and address misalignment within your organization, focusing on people, practices, and technology.
- Empowering Agile at Scale: Discover the true transformative potential of agile at scale. Our speakers will shed light on how businesses can harness the power of agile methodologies to drive lasting change, improve collaboration, and achieve remarkable outcomes.
Whether or not you made it to the 2023 SAFe Summit, you won’t want to miss this webinar. Get perspective from multiple speakers with decades of agile experience, and discover how you can become an agile champion for change at your organization.
Register today to be a part of this transformative experience!
 Danielle Paula

![[New Webinar] Calming the Chaos of Misalignment: SAFe® Summit Takeaways](https://go.isostech.com/hs-fs/hubfs/agile-misalignment-webinar-linkedin-register.png?width=800&name=agile-misalignment-webinar-linkedin-register.png)
 Isos Technology
4 MIN READ
Isos Technology
4 MIN READ
